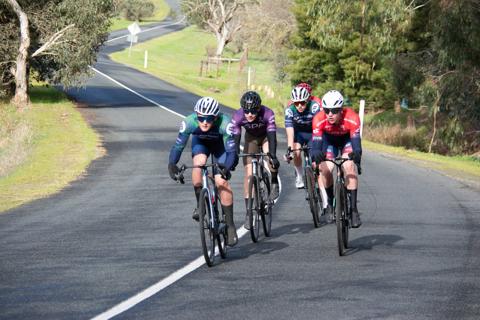
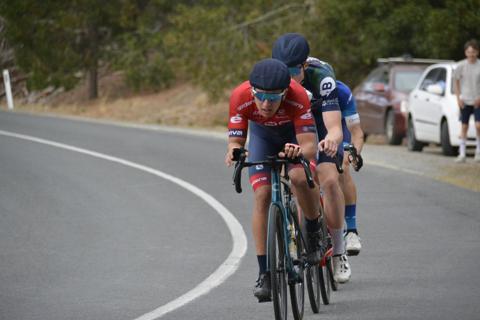
Live link
Results (lap data)
All
B grade ·
Primes on laps 3 and 6
What the codes mean
# Name Time Team Gender Laps
1 Zane ESPIE Alice Springs Cycling Club · M 1:41:37 Alice Springs Cycling Club M 2 Alexander EVANS Norwood Cycling Club · M +2:32 Norwood Cycling Club M 3 Tom PFITZNER FRA PowerOn/New Energy Racing · M +7:11 FRA PowerOn/New Energy Racing M
Most Aggressive
Average lap placing across this ride, for riders who completed every lap — lower is further towards the front.
Gap progression
Rider Lap 1 Lap 2 Lap 3 Lap 4 Lap 5 Lap 6 Lap 7 Lap 8 Lap 9 Lap 10
Zane ESPIE +0:00 +0:00 +0:00 +0:00 +0:00 +0:00 +0:00 +0:00 +0:00 +0:00 Alexander EVANS +0:00 +0:22 +0:59 +1:42 +2:12 +2:26 +2:31 +2:27 +2:35 +2:32 Tom PFITZNER +0:43 +2:09 +2:46 +3:33 +4:18 +5:00 +5:29 +6:09 +6:54 +7:11
C grade ·
Primes on laps 3 and 6
# Name Time Team Gender Laps
1 Paige CRANAGE Norwood Cycling Club · F 1:36:53 Norwood Cycling Club F 2 Geoff COX Port Adelaide Cycling Club · M +2 Port Adelaide Cycling Club M 3 Daniel BLOCK Coburg Cycling Club · M +3:10 Coburg Cycling Club M 4 Elliot BARRETT South Coast Cycling Club · M +5:06 South Coast Cycling Club M
Most Aggressive
Average lap placing across this ride, for riders who completed every lap — lower is further towards the front.
Gap progression
Rider Lap 1 Lap 2 Lap 3 Lap 4 Lap 5 Lap 6 Lap 7 Lap 8 Lap 9 Lap 10
Paige CRANAGE +0:00 +0:00 +0:00 +0:00 +0:00 +0:00 +0:00 +0:00 +0:00 Geoff COX +0:00 +0:01 +0:00 +0:01 +0:00 +0:00 +0:01 +0:00 +0:02 Daniel BLOCK +0:01 +0:01 +0:39 +0:32 +1:10 +1:30 +1:57 +2:41 +3:10 Elliot BARRETT +0:01 +0:03 +0:41 +0:34 +1:36 +1:55 +2:40 +4:04 +5:06
D grade ·
Primes on laps 2 and 5
# Name Time Team Gender Laps
1 Levi LIDDLE Norwood Cycling Club · M 1:15:07 Norwood Cycling Club M 2 Will BARTLETT Norwood Cycling Club · M +2 Norwood Cycling Club M 3 Shuyi LI Riverland Cycling Club · M +2 Riverland Cycling Club M 4 Annabelle KELLY Norwood Cycling Club · F +1:02 Norwood Cycling Club F 5 Mark HARVEY CARR- Alice Springs MTB club · M +1:28 CARR- Alice Springs MTB club M 6 Jordan KUBE Adelaide Hills Cycling Club · M +2:22 Adelaide Hills Cycling Club M 7 Craig HUTCHENS Adelaide Hills Cycling Club · M +6:07 Adelaide Hills Cycling Club M 8 John BRENNAND Adelaide Hills Cycling Club · M +6:08 Adelaide Hills Cycling Club M 9 Isabel CRANAGE Norwood Cycling Club · F +10:54 Norwood Cycling Club F DNF Martin SHEARS MOOD Racing · M MOOD Racing M
Most Aggressive
Average lap placing across this ride, for riders who completed every lap — lower is further towards the front.
E grade ·
Primes on laps 2 and 4
# Name Time Team Gender Laps
1 Rudi PLOOY M 1:07:38 M 2 Nathan THOMAS Adelaide Hills Cycling Club · M +58 Adelaide Hills Cycling Club M 3 Mark EIGENDORP Adelaide Hills Cycling Club · M +2:23 Adelaide Hills Cycling Club M 4 Haydn MARTIN Adelaide Hills Cycling Club · M +3:02 Adelaide Hills Cycling Club M 5 James KELLY Norwood Cycling Club · M +7:45 Norwood Cycling Club M 6 Heath WRIGHT Adelaide Hills Cycling Club · M +7:49 Adelaide Hills Cycling Club M 7 Garth TICHY Adelaide Hills Cycling Club · M +9:19 Adelaide Hills Cycling Club M DNF Matthew AGIUS Port Adelaide · M Port Adelaide M DNF Andrew COOMBE AHC · M AHC M DNF Imogen MCCULLOUGH Norwood Cycling Club · F Norwood Cycling Club F
Most Aggressive
Average lap placing across this ride, for riders who completed every lap — lower is further towards the front.
F grade ·
Primes on laps 2 and 4
# Name Time Team Gender Laps
1 Paul FOUNTAS South Coast Cycling Club · M 1:04:52 South Coast Cycling Club M 2 David STUMM Adelaide Hills Cycling Club · M +9 Adelaide Hills Cycling Club M 3 Peter GRIVELL Norwood Cycling Club · M +2:06 Norwood Cycling Club M 4 Braddon HARVEY Adelaide Mountain Bike Club · M +5:32 Adelaide Mountain Bike Club M 5 David TICHY Adelaide Hills Cycling Club · M +8:51 Adelaide Hills Cycling Club M
Most Aggressive
Average lap placing across this ride, for riders who completed every lap — lower is further towards the front.
G grade ·
Prime on lap 2
# Name Time Team Gender Laps
1 ALFIE TRIMMING Port Adelaide Cycling Club · F 46:27 Port Adelaide Cycling Club F
Most Aggressive
Average lap placing across this ride, for riders who completed every lap — lower is further towards the front.
Gap progression
Rider Lap 1 Lap 2 Lap 3 Lap 4 Lap 5 Lap 6 Lap 7 Lap 8 Lap 9 Lap 10
ALFIE TRIMMING +0:00 +0:00 +0:00
Placing progression
Rider Lap 1 Lap 2 Lap 3 Lap 4 Lap 5 Lap 6 Lap 7 Lap 8 Lap 9 Lap 10
ALFIE TRIMMING 1 1 1
Venue
Bradbury Oval, Bradbury Rd, Bradbury (the course map calls it Bradwood Park Oval)
Times
Rego 8:00 am · Racing 9:00 am
Grades and distances
B B grade: 32.5 to 34.8 km/h over 58.9 km 32.5–34.8 km/h · 58.9 km Start + 10 laps · primes on laps 3 and 6
C C grade: 31.2 to 32.9 km/h over 53.1 km 31.2–32.9 km/h · 53.1 km Start + 9 laps · primes on laps 3 and 6
D D grade: 28.9 to 33.1 km/h over 41.5 km 28.9–33.1 km/h · 41.5 km Start + 7 laps · primes on laps 2 and 5
E E grade: 27.8 to 31.7 km/h over 35.7 km 27.8–31.7 km/h · 35.7 km Start + 6 laps · primes on laps 2 and 4
F F grade: 24.3 to 27.7 km/h over 29.9 km 24.3–27.7 km/h · 29.9 km Start + 5 laps · primes on laps 2 and 4
G G grade: 23.6 km/h over 18.3 km 23.6 km/h · 18.3 km Start + 3 laps · prime on lap 2
20 25 30 35
Fastest to slowest finisher's average speed at Bradbury, 13 Sep 2026, from RaceMix. Distances are race lengths.
Show the numbers Grade Slowest finisher (km/h) Winner (km/h) Distance Laps and primes B 32.5 34.8 58.9 km Start + 10 laps · primes on laps 3 and 6 C 31.2 32.9 53.1 km Start + 9 laps · primes on laps 3 and 6 D 28.9 33.1 41.5 km Start + 7 laps · primes on laps 2 and 5 E 27.8 31.7 35.7 km Start + 6 laps · primes on laps 2 and 4 F 24.3 27.7 29.9 km Start + 5 laps · primes on laps 2 and 4 G 23.6 23.6 18.3 km Start + 3 laps · prime on lap 2
The course
2 4 6 N
380 m 400 m 420 m 440 m
Lap start · km 0.9 Finish · km 6.8 0 2 4 6.9 km
GPX distance 6.9 km · Climb 143 m · Height 379–448 m
Shaded: the steepest 500 m, km 1.1 to 1.6, averaging 5.4%
All about Bradbury →
Facebook, Instagram and their logos are trademarks of Meta Platforms, Inc. YouTube and the YouTube logo are trademarks of Google LLC. Strava and the Strava logo are trademarks of Strava, Inc. RaceMix is not affiliated with, endorsed by, or sponsored by any of them.

 MOOD3 riders
 New Energy Racing1 rider