
Race · Sun 17 Aug 2025
Bradbury (Bradbury)
Adelaide Hills Cycling Club · Sun 17 Aug 2025 Race
Results (lap data)
Grade: B grade
B grade · Red cap
| # | Name | Time | Team | Gender | Laps |
|---|---|---|---|---|---|
| 1 | Joel ROGERSNorwood CC · M | 1:32:15 | Norwood CC | M | |
| 2 | Billy HARNESSNorwood CC · M | +5:41 | Norwood CC | M |
Most Aggressive
Average lap placing across this ride, for riders who completed every lap — lower is further towards the front.
| # | Rider | Laps | Avg lap placing |
|---|---|---|---|
| 1 | Joel ROGERS | 9 | 1.1 |
| 2 | Billy HARNESS | 9 | 1.9 |
Gap progression
| Rider | Lap 1 | Lap 2 | Lap 3 | Lap 4 | Lap 5 | Lap 6 | Lap 7 | Lap 8 | Lap 9 | Lap 10 |
|---|---|---|---|---|---|---|---|---|---|---|
| Joel ROGERS | +0:00 | +0:00 | +0:00 | +0:00 | +0:00 | +0:00 | +0:00 | +0:00 | +0:00 | |
| Billy HARNESS | +0:00 | +0:00 | +0:00 | +1:09 | +2:17 | +2:56 | +4:00 | +5:06 | +5:41 |
Placing progression
| Rider | Lap 1 | Lap 2 | Lap 3 | Lap 4 | Lap 5 | Lap 6 | Lap 7 | Lap 8 | Lap 9 | Lap 10 |
|---|---|---|---|---|---|---|---|---|---|---|
| Joel ROGERS | 1 | 2 | 1 | 1 | 1 | 1 | 1 | 1 | 1 | |
| Billy HARNESS | 2 | 1 | 2 | 2 | 2 | 2 | 2 | 2 | 2 |
Road
Bradbury Oval, Bradbury Rd, Bradbury (the course map calls it Bradwood Park Oval)
Rego 8:00 am · Racing 9:00 am
Grades and distances
A32.7–38.3 km/h · 58.9 kmStart + 10 laps · primes on laps 3 and 6
B36.1–38.3 km/h · 58.9 kmStart + 10 laps · primes on laps 3 and 6
C32.5–34.6 km/h · 53.1 kmStart + 9 laps · primes on laps 3 and 6
D31.6–33.0 km/h · 41.5 kmStart + 7 laps · primes on laps 2 and 5
E25.1–31.5 km/h · 35.7 kmStart + 6 laps · primes on laps 2 and 4
F24.0–27.6 km/h · 29.9 kmStart + 5 laps · primes on laps 2 and 4
G23.3 km/h · 18.3 kmStart + 3 laps · prime on lap 2
Fastest to slowest finisher's average speed at Bradbury, 17 Aug 2025, from RaceMix. Distances are race lengths.
Show the numbers
| Grade | Slowest finisher (km/h) | Winner (km/h) | Distance | Laps and primes |
|---|---|---|---|---|
| A | 32.7 | 38.3 | 58.9 km | Start + 10 laps · primes on laps 3 and 6 |
| B | 36.1 | 38.3 | 58.9 km | Start + 10 laps · primes on laps 3 and 6 |
| C | 32.5 | 34.6 | 53.1 km | Start + 9 laps · primes on laps 3 and 6 |
| D | 31.6 | 33.0 | 41.5 km | Start + 7 laps · primes on laps 2 and 5 |
| E | 25.1 | 31.5 | 35.7 km | Start + 6 laps · primes on laps 2 and 4 |
| F | 24.0 | 27.6 | 29.9 km | Start + 5 laps · primes on laps 2 and 4 |
| G | 23.3 | 23.3 | 18.3 km | Start + 3 laps · prime on lap 2 |
The course
- The route
- The climb to the line
- Direction of travel
- Start
- Lap start
- Finish line
- Km into the route, every 2 km
Lap start · km 0.9Finish · km 6.8
GPX distance 6.9 km · Climb 143 m · Height 379–448 m
The climb to the line: km 6.5 to 6.8, rising 20 m at 5.6%
Shaded: the steepest 500 m, km 1.1 to 1.6, averaging 5.4%
Teams Represented
- Butterfields Ziptrak Racing2 riders
- Hold Fast2 riders
 MOOD2 riders
 New Energy Racing2 riders
- Move OT1 rider
- Norwood Cycling Club1 rider
 PMA Guestpix1 rider
- Port Adelaide Cycling Club1 rider
- Septimus Racing1 rider
Photos
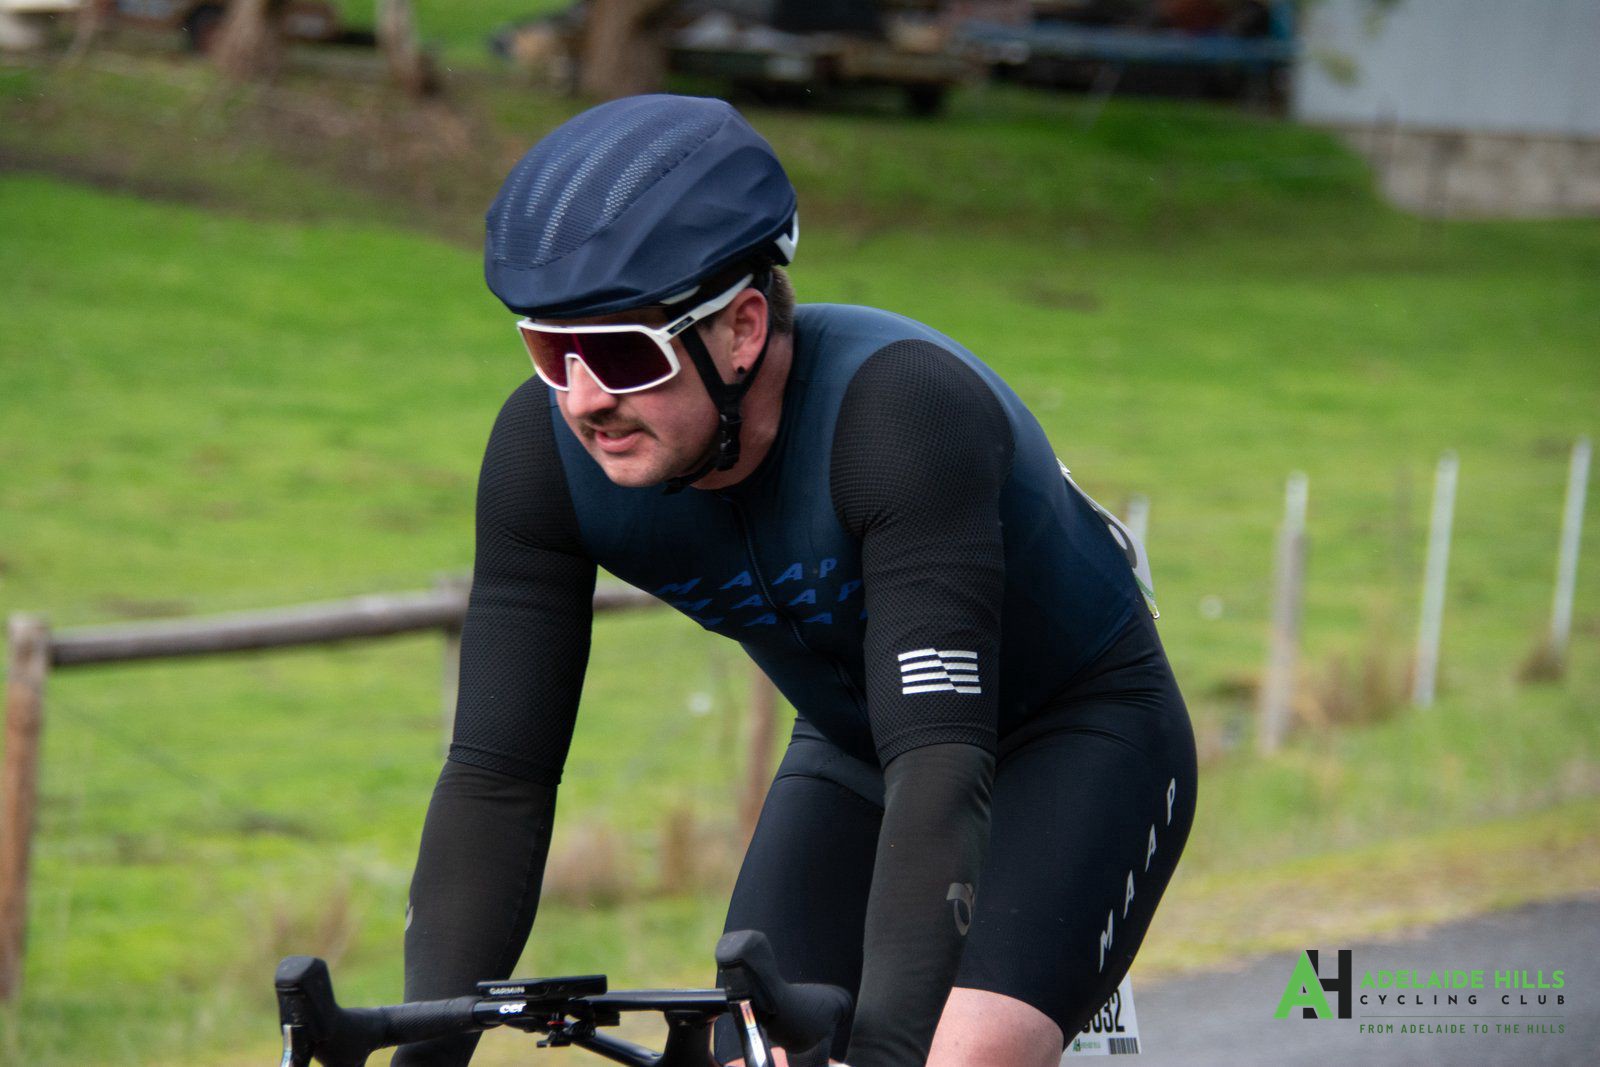
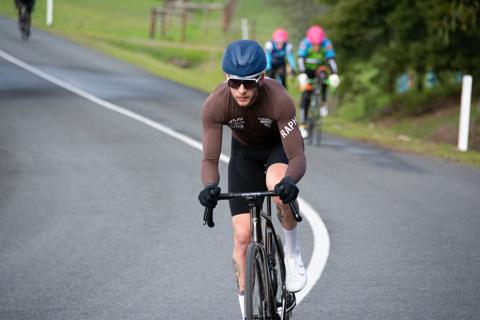
From past races here
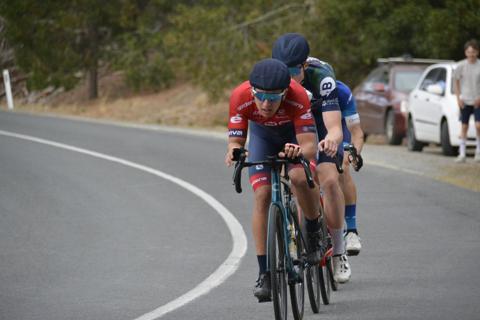
Facebook, Instagram and their logos are trademarks of Meta Platforms, Inc. YouTube and the YouTube logo are trademarks of Google LLC. Strava and the Strava logo are trademarks of Strava, Inc. RaceMix is not affiliated with, endorsed by, or sponsored by any of them.